CRISIS ON GEORGIAN BAY
Longtime Georgian Bay cottager, sailor and now resident, John Jamieson, has a long relationship with The Bay and its water levels. What follows is his considered perspective on the current 'crisis' that exists with low water levels, in response to a series of articles recently published in The Midland Mirror. Editor
Is this a real crisis or journalistic hyperbole? Are the authors deliberately distorting the facts to prove their hypothesis? There is no question that present water levels are close to the historic lows set in 1964/5. But other than last December, which barely broke the record, we have not dipped below them as your first article implied. The fact that water levels have been above average from 1968 to 1999 (with the exception of a brief period from 1989 to 1991 when levels dipped slightly below the norm) might be distorting the public’s impression of what is normal. This situation may be exacerbated by the fact that levels have been below average for the last 14 years, the longest stretch in recorded history. But an average requires data to be both above and below the mean. Is this just a concern or a crisis? Levels in the Lakes have been cyclical for thousands of years and the climate has been the main factor in the cycle.
 I do not recall the same kind of hoopla surrounding the record lows in the summer of 1964. Yes boaters hit rocks but people back then were more familiar with the cyclic nature of the Bay (the water had been nearly as low in1950 and 59) and just accepted it as the way Mother Nature worked. In addition, we were not inundated by the plethora of crisis cries in the more invasive media. There was concern about the amount of water being taken out at Chicago but as far as the general public was concerned, the St. Clair River was not even on the radar. Now the situation has reversed and you don’t hear much about Chicago. But things have changed. Communities have grown significantly and are likely taking much more water out of the Lakes. In addition recreational boats have become larger and draw more water. Marinas are more numerous than they were in the 60's and of course need more water at their docks to float the bigger boats. All of these voices have contributed to the cacophony. But are they crying wolf?
Your (The Midland Mirror's) first article “Worries abound as water levels dip to historic lows” provided an interesting anecdote in Charlie Sawyer’s story, but 5000 hits on You-Tube shows the sensational side of the issue and doesn’t really provide relevant facts. Although I have been around a bit longer than Charlie, I have some of the same concerns as he does. I too have an island and have had an interest in the water levels since I was old enough to go up there in 1947. The interest has grown now that I have retired from the Navy and sail my boat with a six foot draft in the area. I have hit rocks during low years when I wasn’t paying attention to where I was going. I had a particularly embarrassing moment in the summer of 1964 when as an aspiring naval officer, I had just returned for some leave after a period of intensive navigation training on the West Coast. Back then the buoyage systems on the Great Lakes and the ocean were reversed and I guess I was still in salt water mode when I went on the wrong side of a buoy and hit a rock that wasn’t there when the water was higher. But that’s what charts are for and I wasn’t using one as I was in the local area and “knew where I was going”. However the long time residents of Point Au Baril, quoted in your first article as saying that the water level is the worst it’s ever been, probably hadn’t arrived yet in 1964/65 when it was even lower. Most people have also likely forgotten the inconvenience of the high water years when cottages were jacked up and rolled back and docks had to be rebuilt due to the high water. Highs and lows are just part of the ongoing cycle.
The graph in the (Midland Mirror's) second article “No Simple Solution” is quite misleading. First of all, the author has distorted things by throwing 2013 into the comparison. The rest of the years show annual averages and 2013 only the first 3 or 4 months when the water levels are at their lowest. It is statistically incorrect to compare two completely different sets of data in an attempt to show that 2013 is a “crisis” year.
 In addition it appears that the presentation of data in the chart has been skewed, either through ignorance or a deliberate attempt to distort the facts to prove the hypothesis. By selectively choosing data every 10 years starting in 1922 you have shown a false picture of an almost continuous decline in water levels since 1952. If you had used a graph showing the full range of the water level cycle data your readers could see the ups and downs of the cycle. We experienced the highest level in recorded history in 1986 (not shown on your graph) and above or slightly below 1952 levels in 1929, 1973, 1974 and 1997. Water levels have in fact been above average from 1968 to 1999 (with the exception of 1989 and 90). It would have been more helpful to show the graph of the actual cycle and speak to the issues which caused the fluxuations, especially as we are in an unusual cycle with the longest period of below average levels on record. This 14 year period has experienced the lowest variation in the highs and lows which is even more interesting. This enigma that is contributing to the perception of the so called “crisis” has not been addressed in your first two articles but the data is available to do this.
The last two years have been a bit of an aberration as the lack of a large snowpack during the winter of 2011 and 2012, coupled with increased winter evaporation due to low ice cover and the very hot and dry summer of 2012, were the biggest factors leading to the lower water levels last year and at the beginning of this year. Although December 2012 broke the lowest record (only just), the 2012 annual average was still above the 1964 level. This year saw January and February near, but above, the record low 1964/5 figures. The levels have continued to rise above the record lows and are forecast to continue doing so into the summer. The fact that last winter and this spring have been more normal has resulted in a rise that has followed the normal gentle upwards curve (it is a curve, not a bump as stated in your first article). April has seen a 24 cm increase which is only 1 cm less than the record April rise experienced in 1951 and the upwards trend has continued throughout May. The good news in the most recent forecast is for a normal seasonal rise in water levels of 0.2 to 0.3 metres (last year's seasonal rise was just 0.1 metre), with summer levels remaining around chart datum.
 It will be interesting to see the outcome of the IJC’s recommendations. The bottom line is likely to be the almighty dollar and under the current fiscal situation, it is questionable whether the Governments will be able or willing to allocate the necessary funding in the near term to raise the water levels by the 13 to 25 cm indicated in the Report. In any event, environmental studies will have to be done and as they take quite a bit of time we probably won’t see any concrete results within the next decade. This whole process is a bit like trying to stop climate change. Mother Nature is in control and while we may be able to do a bit, our efforts will be puny by comparison. By that time we get the environmental assessments done and get agreement from the fish and communities downstream of the proposed bumps, we should be getting into another high level water cycle.
Since the writing of this article the Third Midland Mirror article has been printed and you can reference it with this link.
If you have another perspective on this issue or wish to share photos of your own please email your submissions to: thodgson@kerrwil.com
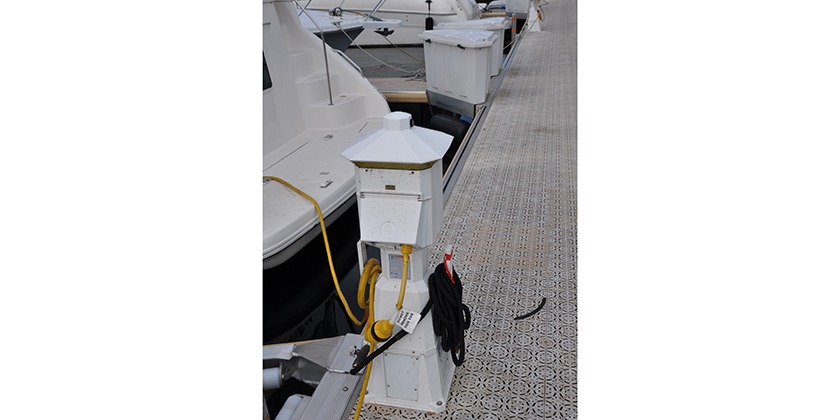
Photo 1 – Dillon, Georgian Bay 2012 credit: John Jamieson
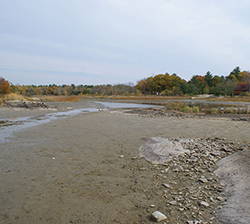
Photo 2 – Georgian Bay 2013 credit: Midland Mirror
Photo 3 – Dillon, Georgian Bay 2013 credit: Terri Hodgson
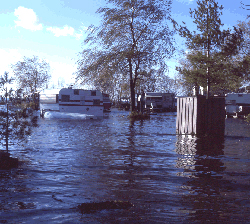
Photo 4 – Picnic Island, Honey Harbour 1986 credit:HoneyHarbour.net


