National pleasure craft licensing stats for the month of January 2022
The following charts gives the Canadian pleasure craft licensing statistics for the month of January 2022.
The following charts gives the Canadian pleasure craft licensing statistics for the month of January 2022.
The following charts gives the Canadian pleasure craft licensing statistics for the month of December 2021.
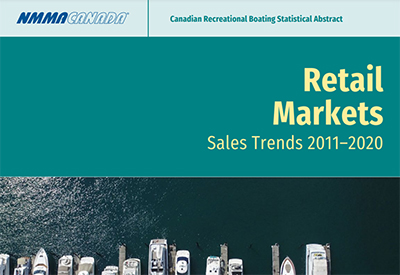
The 2020 Canadian Retail Markets report is now available as a part of the 2020 Canadian Boating Statistical Abstract. This report details new recreational boat and marine engine retail sales data (both unit totals and Canadian dollars) categorized by size, type, and province/territory. Total new boat unit sales across Canada increased 5% compared to 2019.
The following charts gives the Canadian pleasure craft licensing statistics for the month of November 2021.
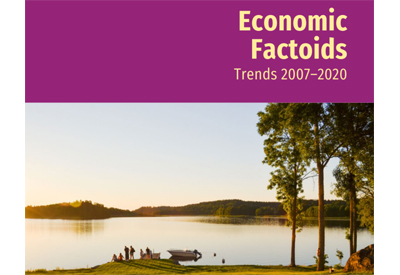
The 2020 Canadian Economic Factoids report is now available as a part of the 2020 Canadian Boating Statistical Abstract. This report looks at Canadian economic indicators from 2007-2020 and identifies trends impacting the retail markets.
The International Council of Marine Industry Associations (ICOMIA) has released the latest edition of its Recreational Boating Industry Statistics. The ICOMIA Statistics Book, as the only product of its kind, provides a wealth of industry intelligence in one useful reference document.
The following are the Canadian Pleasure Craft Licensing statistics for the month of October 2021.
The following are the Canadian Pleasure Craft Licensing statistics for the month of September 2021.
The following are the Canadian Pleasure Craft Licensing statistics for the month of August 2021.
The following are the Canadian Pleasure Craft Licensing statistics for the month of July 2021.
The Sailboat Sales Trends section of NMMA’s 2020 U.S. Recreational Boating Statistical Abstract is now available on NMMA.org. This report includes production and retail unit sales data, export unit sales by length, import unit sales by length, estimated total annual retail sales, and retail sales by length.
The Marina Economic Impact Calculator – a simple but powerful tool that lets a marina input gross revenues to calculate its impact on the local economy.
The following are the national pleasure craft licensing stats for both the month of May and the month of June 2021.
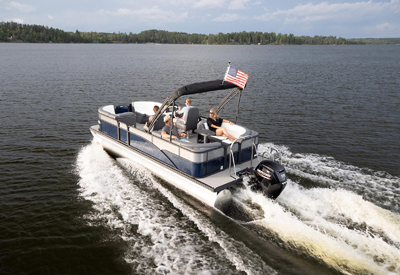
The NMMA reports that new boat sales in the U.S. remained strong through April, according to the latest New Powerboat Registrations Report. Data shows retail unit sales of new powerboats were up 32 percent on a rolling 12-month (R12M) year-over-year (YOY) basis through April, reflecting the surge in demand and sales over the past year.

ICOMIA has released its latest Q1 2021 economic report covering economic indicators such as inflation rates, gross domestic product growth, car registrations, producer prices, and consumer confidence, in 44 countries across the world.
The Total Industry Sales by Category and State section of NMMA’s 2020 U.S. Recreational Boating Statistical Abstract is now available on NMMA.org.
The following are the Canadian Pleasure Craft Licensing statistics for the month of May 2021.

With the boost in popularity that recreational boating has enjoyed in Canada this past year, the need for modern marine security and safety regulations is more pressing than ever.

NMMA’s Monthly Shipment Report (MSR) has been updated with February 2021 data, which shows wholesale shipments of new powerboats up 23% compared to the 2020 average, and up 9% compared to the 2019 average.
The following are the Canadian Pleasure Craft Licensing statistics for the month of April 2021.